Testing and Debugging
There are several features in Nussknacker designed specifically to ease testing and debugging; this page provides a brief explanation how to use them. This functionality is grouped in the Test panel; if you did not rearrange panels it is in the right part of the Designer canvas.
Test data capture
(Streaming processing mode only)
You can use generate button to capture events from the input Kafka topic into the file. You will be prompted to enter number of events to be captured. This feature works also if there are multiple Kafka input topics to the scenario.
Below you can see how such file looks like.
{"sourceId":"kafka1","record":{"keySchemaId":null,"valueSchemaId":null,"consumerRecord":{"key":null,"value":{"clientId":"4","amount":30,"eventDate":1674548921},"topic":"transactions","partition":0,"offset":58209,"timestamp":1674548933921,"timestampType":"CreateTime","headers":{},"leaderEpoch":0}},"timestamp":1674548933921}
{"sourceId":"kafka2","record":{"keySchemaId":null,"valueSchemaId":null,"consumerRecord":{"key":null,"value":{"clientId":"4","amount":30,"eventDate":1674548921},"topic":"transactions","partition":0,"offset":58209,"timestamp":1674548933921,"timestampType":"CreateTime","headers":{},"leaderEpoch":0}},"timestamp":1674548933921}
Each line of this file represents the next ongoing event and specify which source it targets with sourceId field. The json representation of the event is in record field.
Testing using events from file
A scenario can be tested with events coming from a file; this can be very handy if several test passes on the same input events are needed before the scenario is deemed ready. Similarly, as with test data capture, this feature also works with multiple sources.
All you need to do is to reuse file you already have from the Test data capture step or prepare such file manually e.g. for the Request-Response processing mode.
If you want to read more than 20 records from file, you will need to change testing settings.
Debugging node behaviour
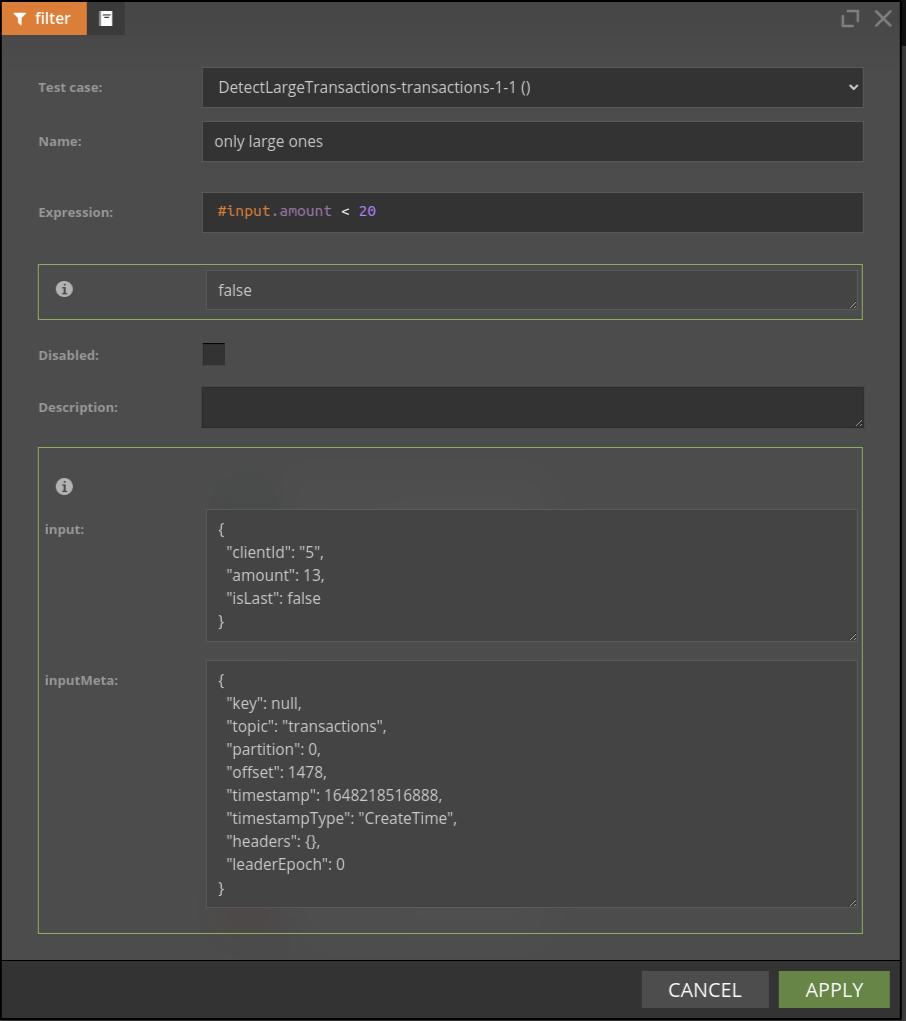
Almost all nodes use SpEL expressions; sometimes it is not clear what was the result of the SpEL expression for the given input record. If scenario is run using data from file it is possible to check results of expression evaluation - separately for each input record.

You can also watch this video to see debugging functionality in action.
Watching nodes filtering behaviour with counts
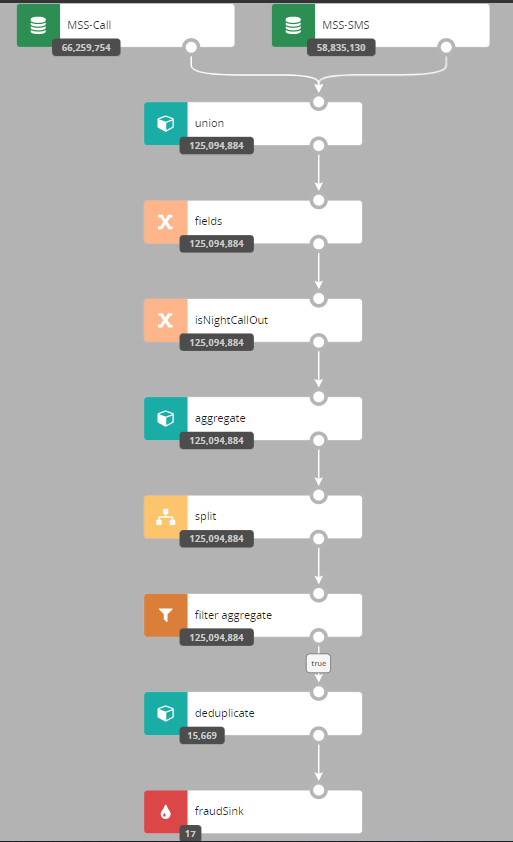
Understanding how many events passed through a given node can be very handy during debugging - choose counts button to see the counts snapshoot. The number displayed is the number of events which entered a given node.
In some edge cases, you may need to change algorithm used for counts computations - consult the counts configuration for details.
