Nussknacker application in Data Lakehouse architecture: Apache Iceberg example

The Data Lakehouse architecture is a solid foundation for modern analytics solutions. It allows users to store data in relatively cheap and scalable storage services such as HDFS or Amazon S3. Stored data can be processed by multiple compute engines thanks to open specifications. This extends the possibilities of applications in business use cases and reduces the risk of vendor lock-in. In the latest release, Nussknacker added support for Flink catalogs. Thanks to this feature, it is possible to add Nussknacker on top of solutions such as Apache Iceberg and use it for various purposes such as data ingestion, transformation, aggregation, enrichment and implementation of business logic based on this data. In the blog post, I'll show how to implement an example business use case by combining Nussknacker and Apache Iceberg.

1. Introduction
2. Example use case
3. Setup preparation
4. Use case implementation

Introduction: Apache Iceberg

First, let me explain what components Apache Iceberg consists of and how it benefits users. The main part of Apache Iceberg is an open metadata specification that describes where a piece of data is, in what schema, and how to read it efficiently. This abstraction is called the table format. This concept was already available in earlier solutions, for example, Apache Hive. However, modern table formats such as Apache Iceberg offer many more benefits than the previous one, such as row-level updates, schema evolution, hidden partitioning, ACID, time travel and many more.

Another important abstraction is a catalog abstraction. The catalog is a service that allows managing multiple tables described in table format. Apache Iceberg table definitions are typically stored in the Apache Hive Metastore, Nessie Catalog or JDBC storage. In 0.14.0, Iceberg also exposed the REST Catalog OpenAPI Specification, which can be implemented by service providers.

The final piece of the puzzle is the catalog connector. The catalog connector allows compute engines to understand how to communicate with catalogs and how to read tables described in table format. Apache Iceberg provides connectors for Apache Flink, Apache Spark and Apache Hive but there are also connectors maintained by other projects, for example, Trino. There are higher-level applications that are built on top of compute engines. One of these is Nussknacker or Flink SQL.

The architecture that combines these concepts is the Data Lakehouse. You can find other implementations of this architecture such as Apache Hudi, Delta Lake or Apache Paimon

Now let’s look at potential business use cases for Data Lakehouse and where Nussknacker can help in their implementation.

The application of Nussknacker in Data Lakehouse architecture

The Data Lakehouse can be used in various business use cases. Some of them are:

  • Reports 
  • Batch marketing campaigns
  • Customer scoring
  • Revenue Assurance 

It can also be used in places where relatively low latency is important, such as near-real-time marketing campaigns or for backfilling for streaming pipelines.

Each use case requires some common tasks:

  • Data ingestion/egression
  • Data discovery
  • Data transformations such as unification, deduplication, cleansing, aggregation, enrichment
  • ML model feature extraction
  • ML model training
  • ML model inference
  • Applying business logic to prepared data

Nussknacker allows you to realise tasks related to data ingestion, egression, transformations, feature extraction, business logic application and model inference. Let’s take a look at it from the perspective of these tasks.

Unlike with compute engines such as Apache Flink, Apache Spark, with Nussknacker, you don’t need to use additional tools: Version Control Systems, Building tools, Integrated Development Environments or Continuous Deployment Platforms to prepare and deploy your solution – you can do everything in one tool. You also don’t need a strong coding background – it uses a similar semantic as SQL queries but in a less restrictive form of graphs. Moreover, it contains components (building blocks of the graph) that allow you to easily model decisions in the flow: filter, choice, split, union, join, decision table, etc. These things help you to focus on business needs and make it perfect for business logic modelling.

Thanks to the rich set of stateful components, enrichers and the SpEL expression language, it allows most data transformations to be handled with ease. It also has a dedicated component for ML model inference, which you can read more about in this blog post. The components and functions available in the expression language are pluggable - you won’t hit a wall when a specific transformation is required.

Data ingestion/egression pipelines are possible thanks to the Flink Table API connectors that are used by our table components.  

In addition, Nussknacker, much like Flink SQL, unifies stream and batch processing. Picture a marketing team that wants to implement a batch marketing campaign. It occurs to them that this campaign will perform better if the data is processed in real-time, as then they won’t have to rewrite everything from scratch; they can just reuse the same concepts. Nussknacker takes this a step further. Let’s say that the same marketing team wants to implement a Next Best Action use case. They don’t need to rewrite the architecture either – they can simply use a request-response processing mode that is also available in Nussknacker.

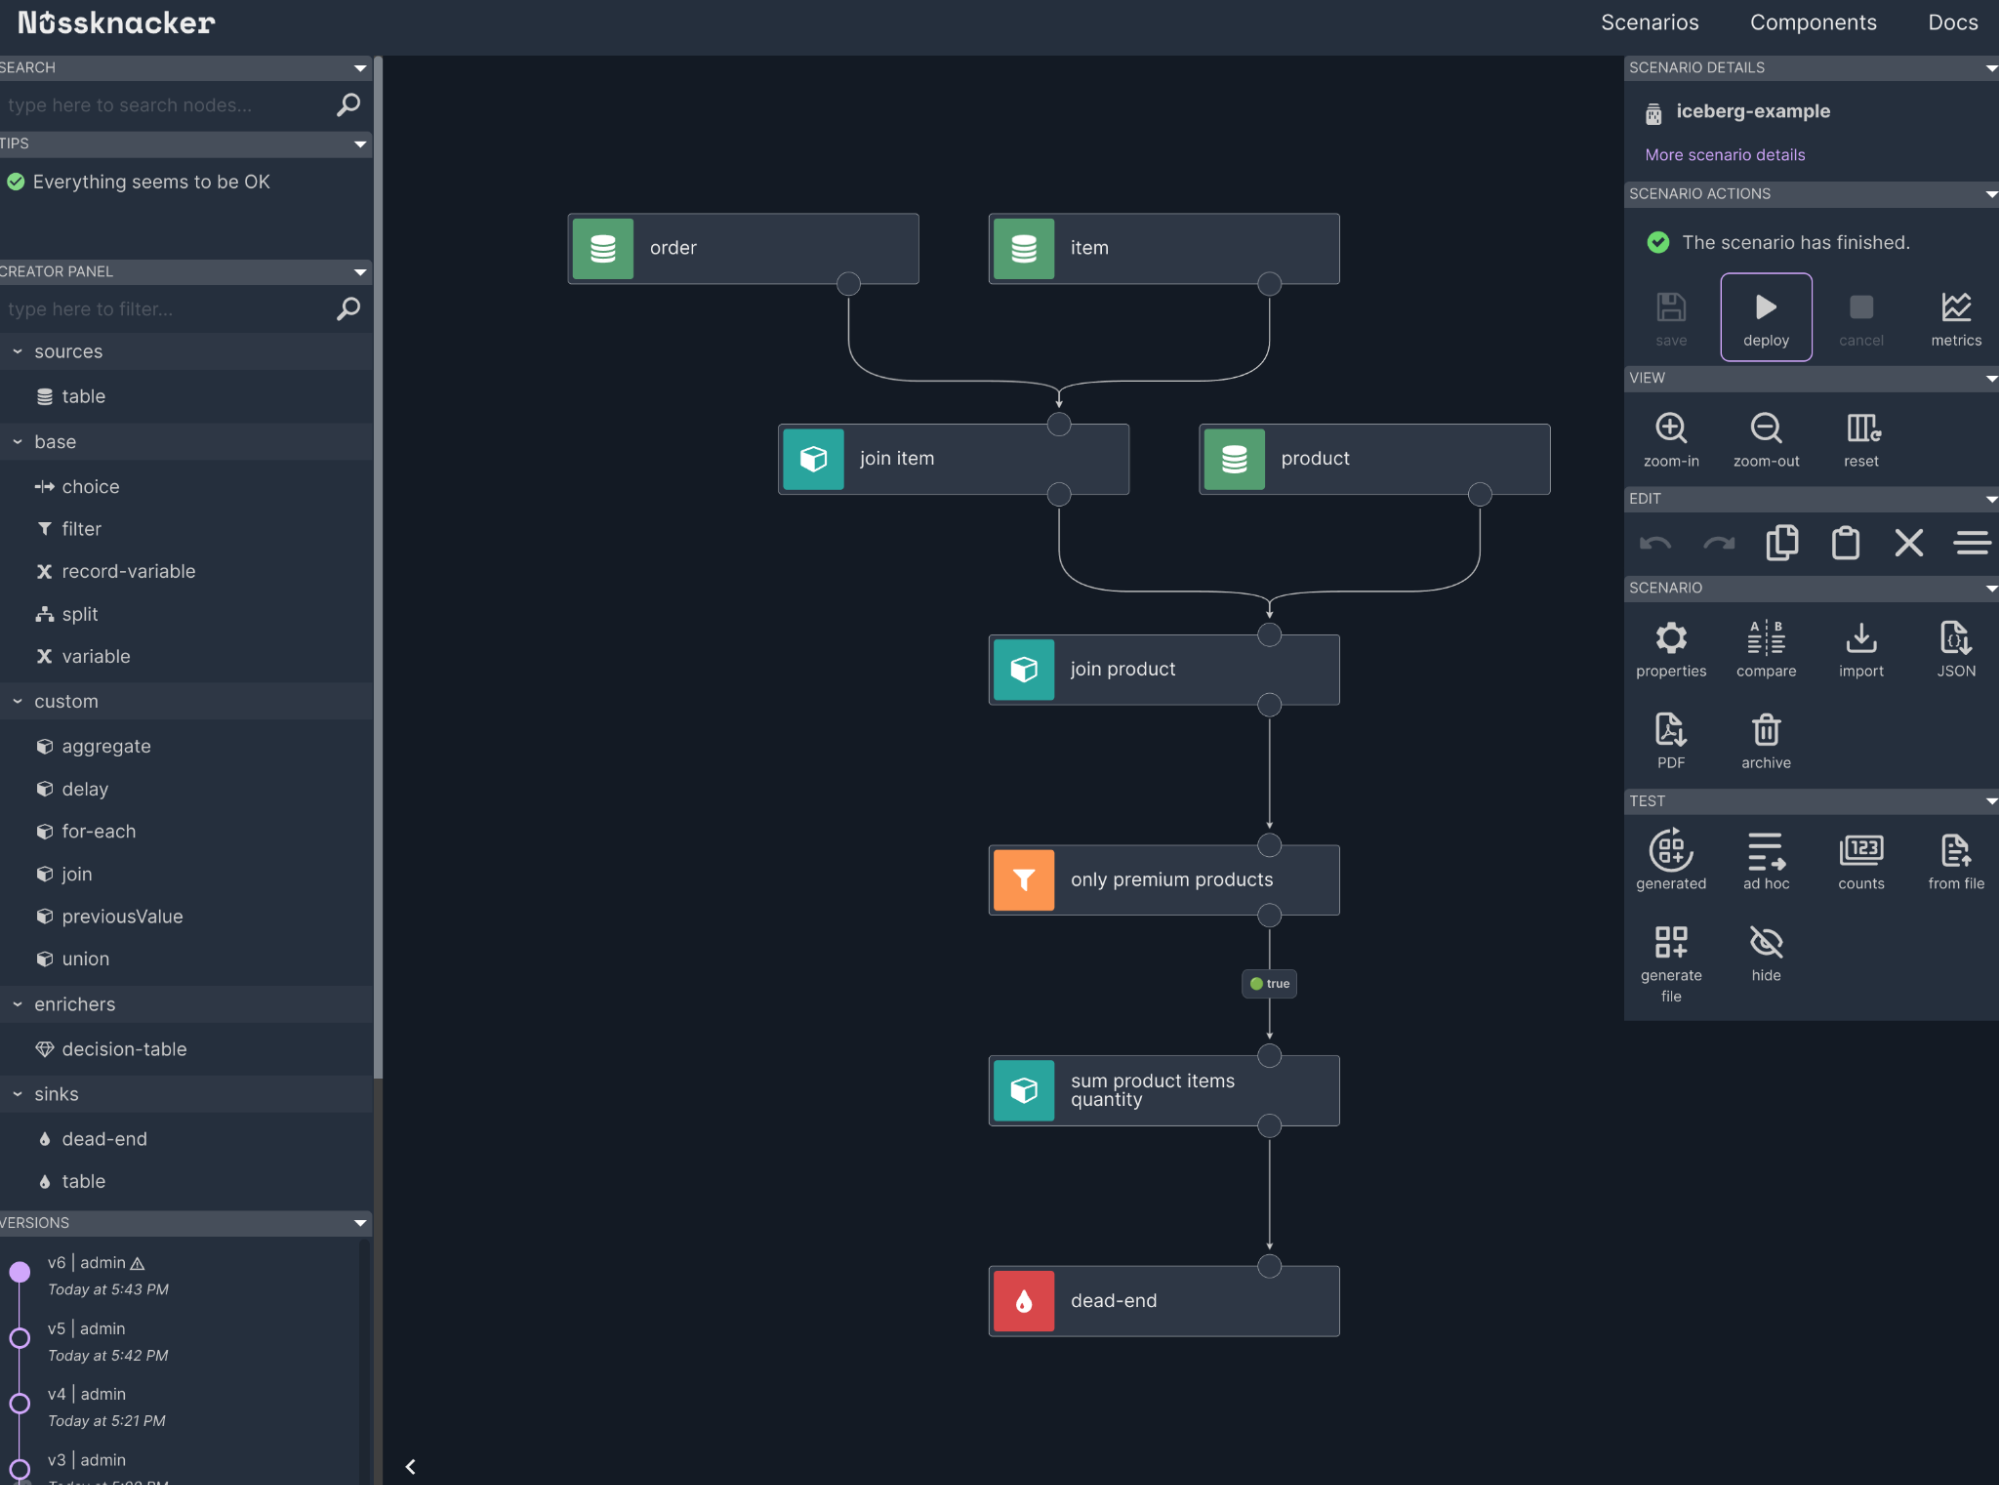
To better understand the role of Nussknacker in this ecosystem, I’ll show how to implement the reporting use case. Nussknacker will be used to define the business logic of the report.

Example use case - periodical report

The use case is straightforward. Additionally, I’ll make some simplifications to ensure that the essential elements are not obscured. As a user, I want to prepare a report for a specific audience. The report will be sent to them once a day. In our company, we have two systems which hold data that I’m interested in:

  • CRM (Customer Relationship Management) – which stores orders of products
  • CCMS (Component Content Management System) – where we have our model of products that changes over time; new products are added, old products are marked as withdrawn from production, attributes of products are changed, etc. 

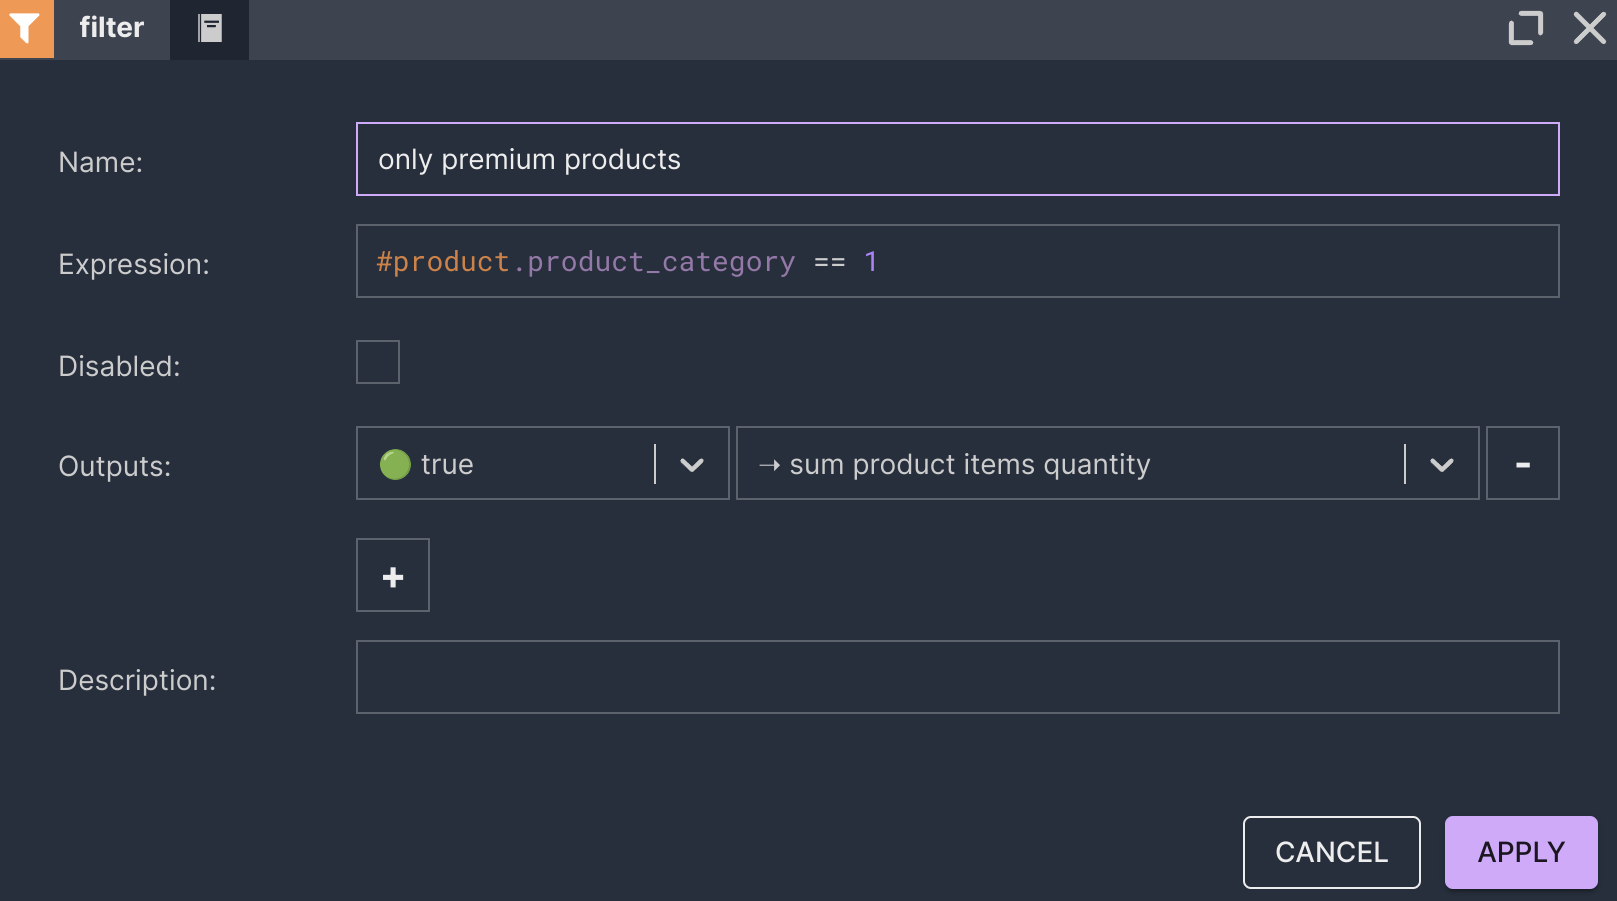
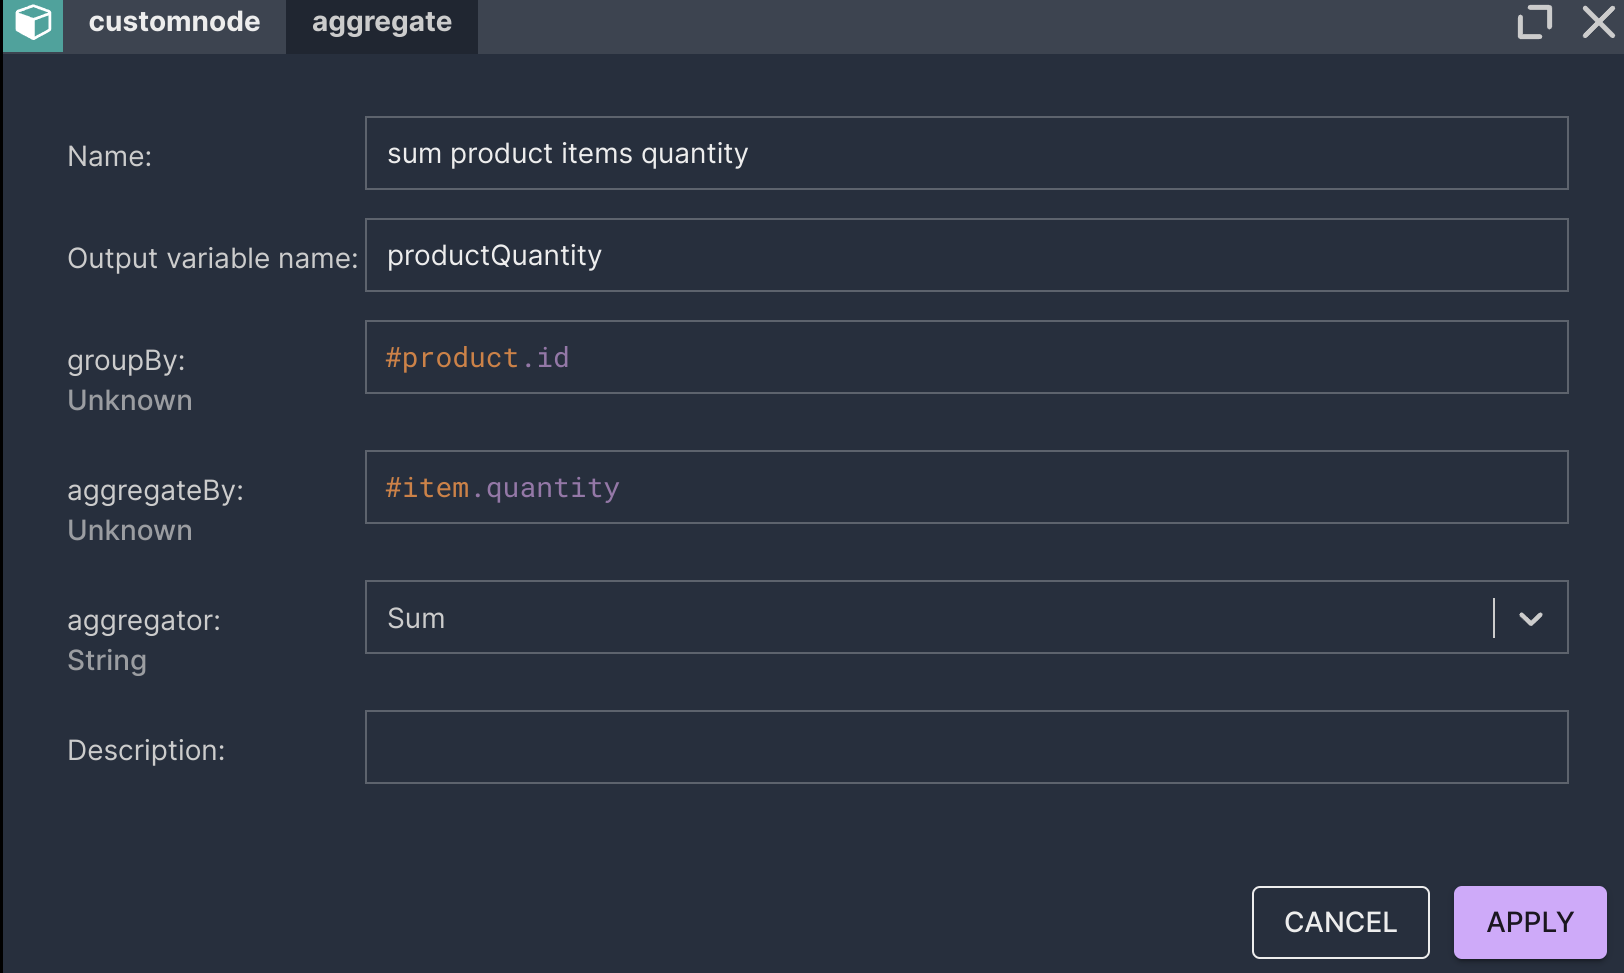
The report should show how many items of each product in the premium category were ordered on a previous day.

The diagram below shows the architecture that we want to simulate.

The whole process will be split into several steps:

  1. Data ingestion. We can’t query data from operational systems too often not to infer them. So we must ingest them into another place that can be queried without hassle. This place will be the Data Lakehouse.
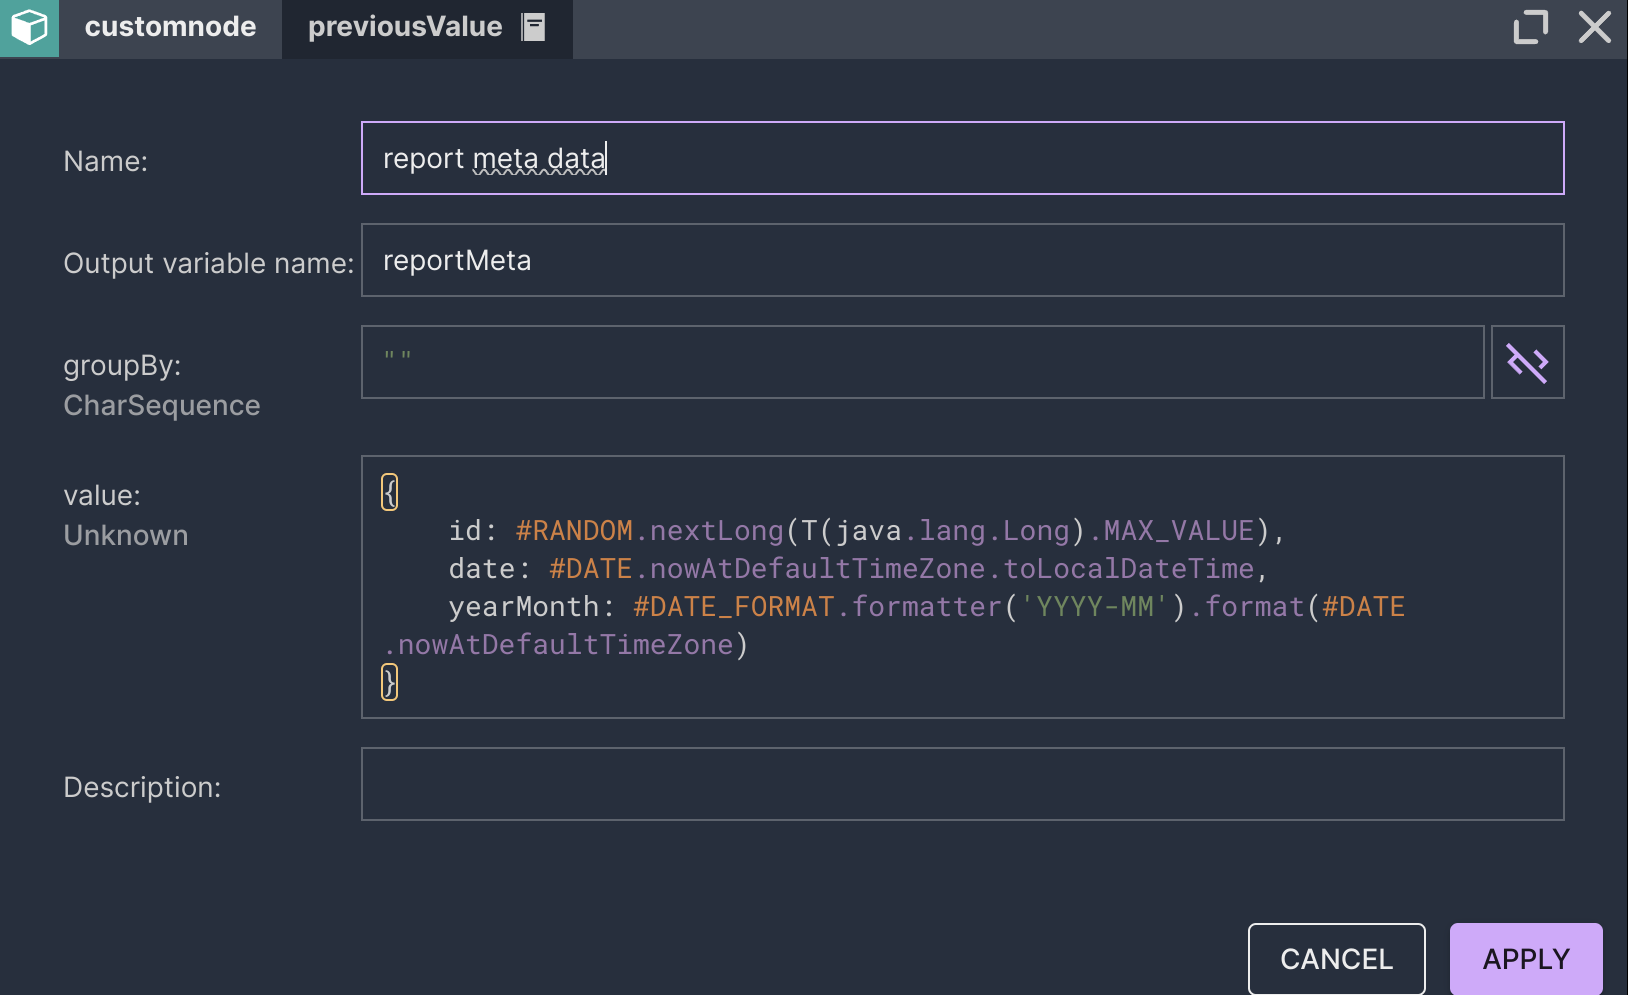
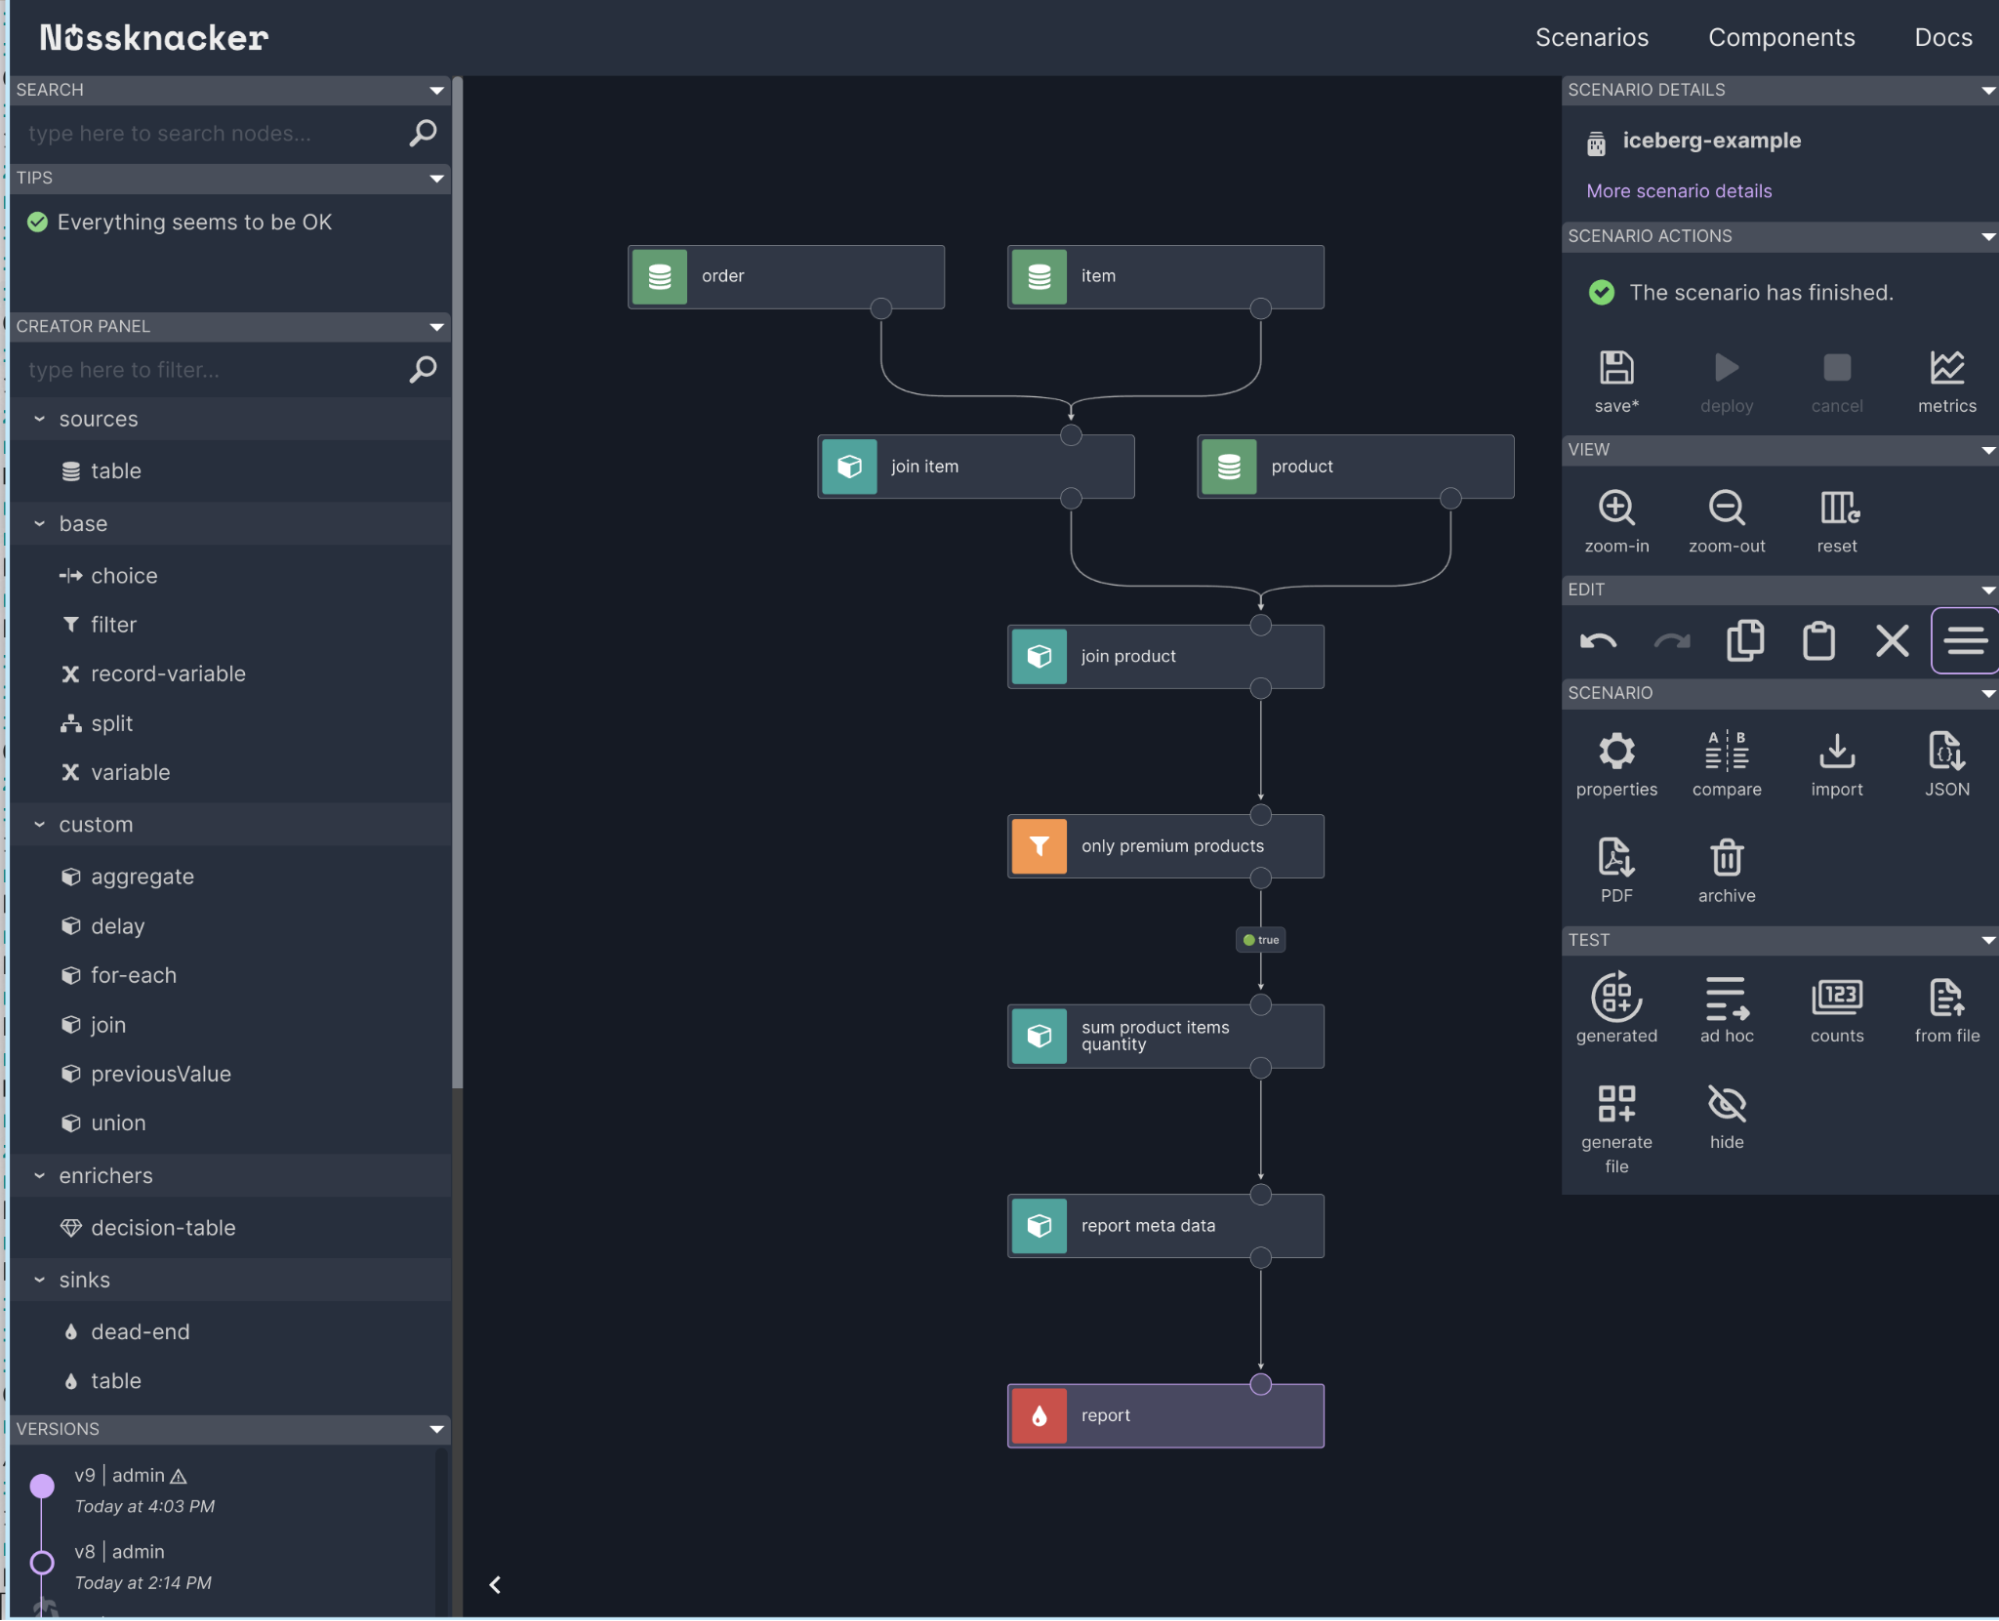
  2. The user defines the core logic of the reporting scenario in Nussknacker.
  3. The user defines the schedule in a scheduling system.
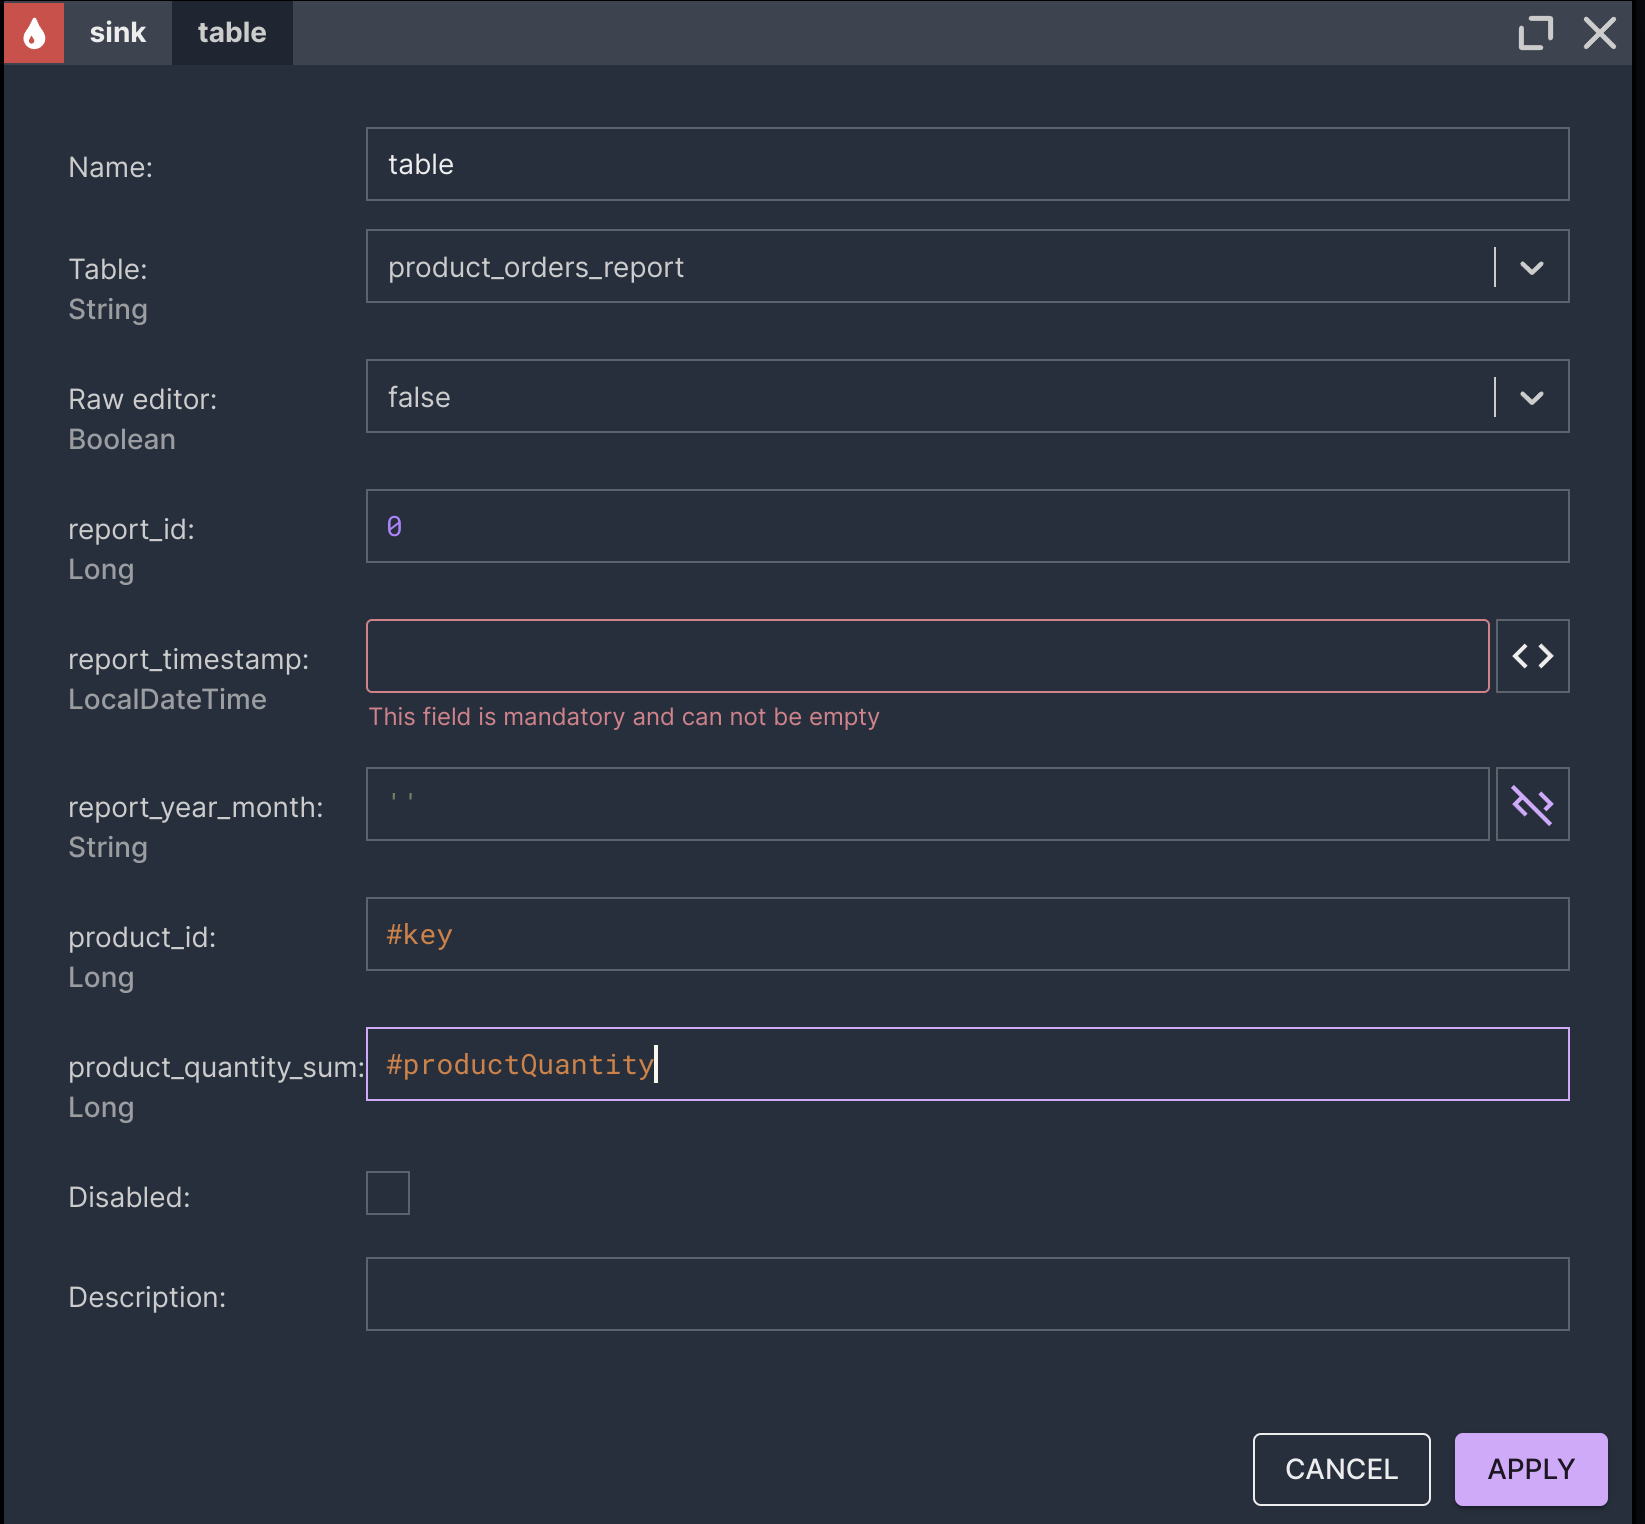
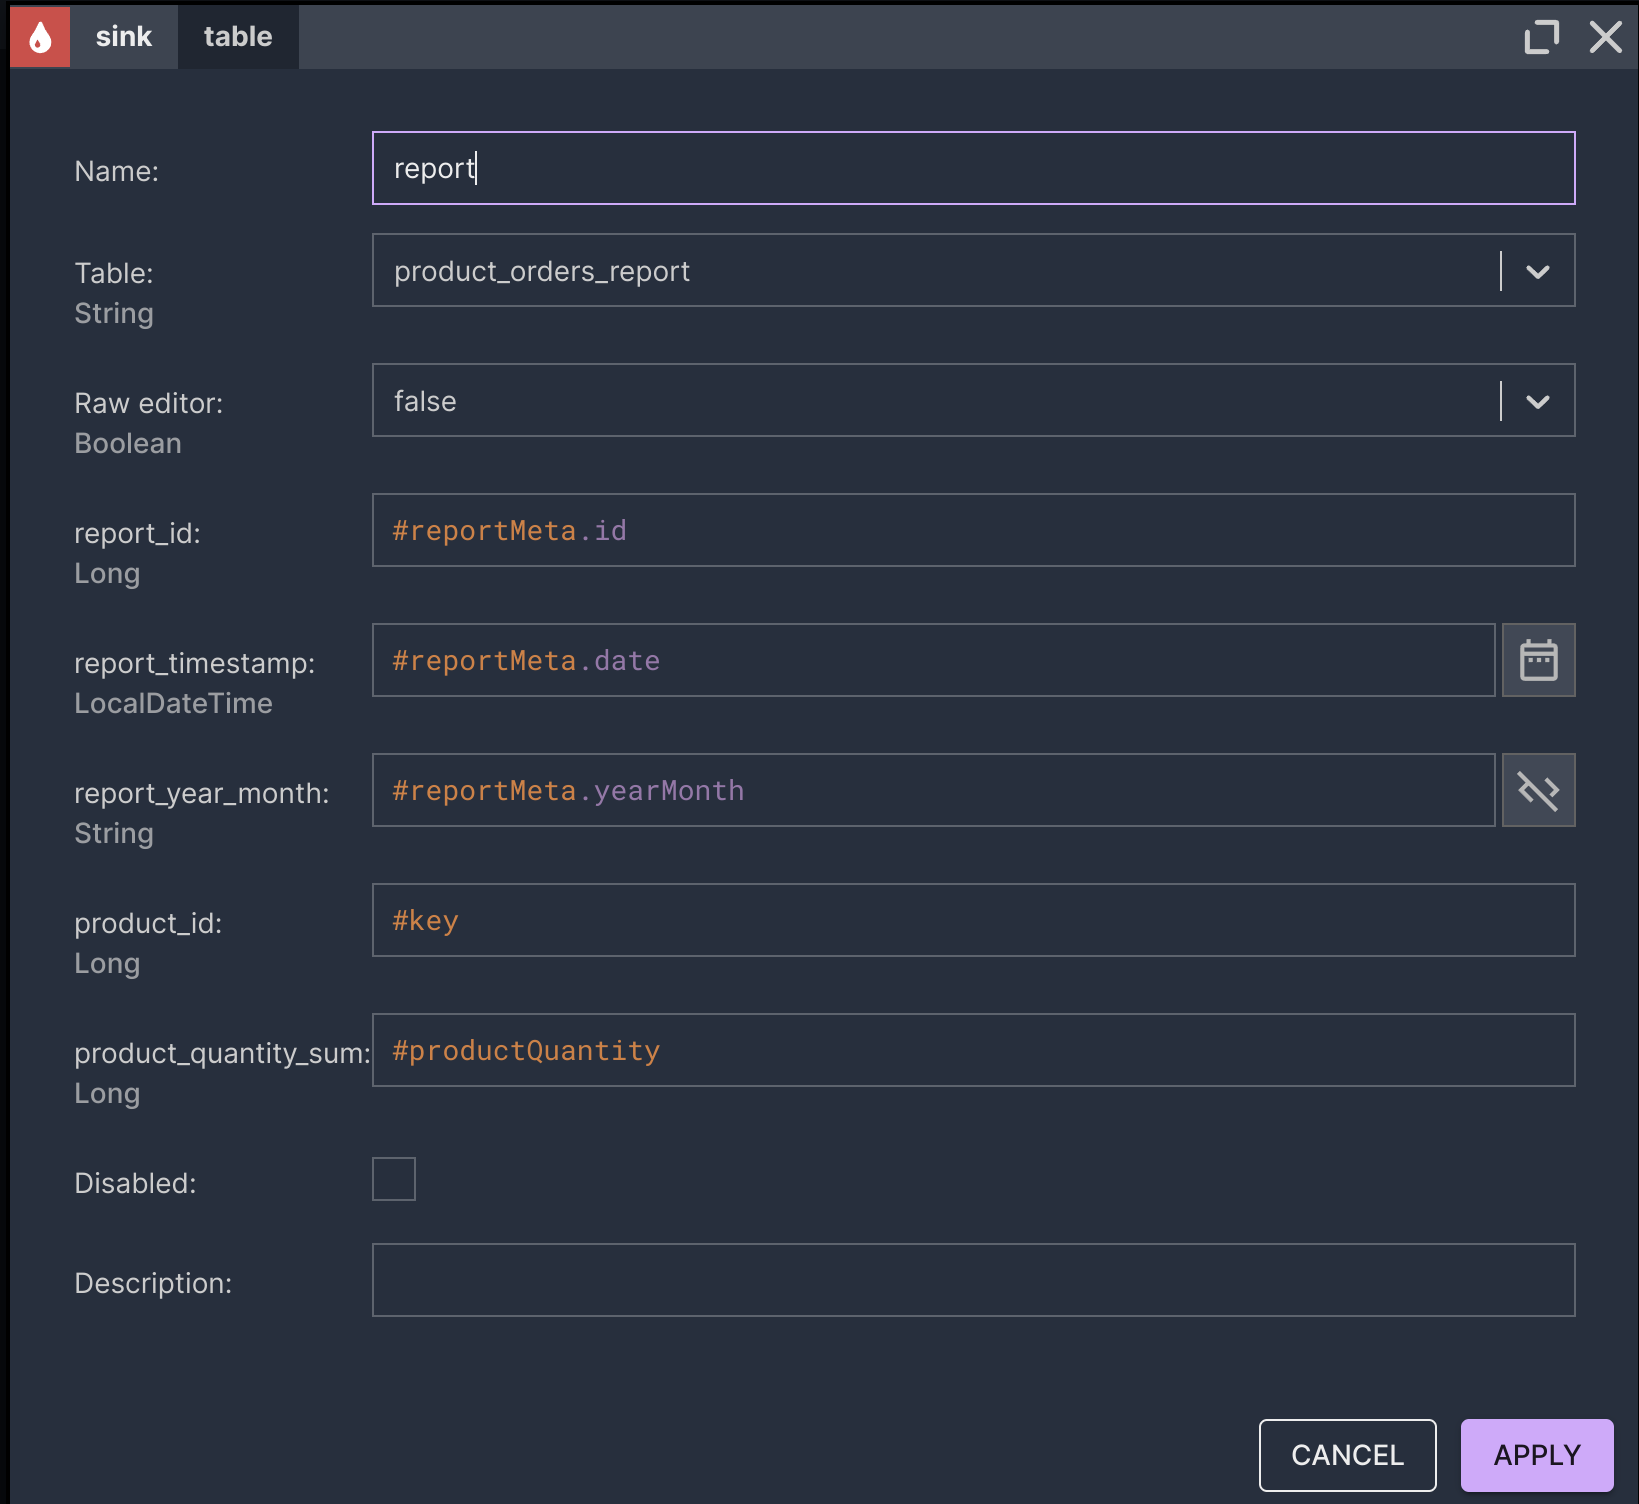
  4. The scheduler triggers a report computation in Nussknacker. Nussknacker produces a report. The report is stored in the Data Lakehouse for record-keeping purposes.
  5. The report is passed to the mail delivery system. This is a reverse process to ingestion. It can be called egress.

Simplifications

Shortcuts that will be applied:

  1. Data ingestion – we’ll mock external systems by inserting queries written in Flink SQL. In a production environment, we would have jobs that do these ingestions. These jobs could be defined, for example, in Nussknacker.
  2. We won’t process product changes. Instead, we’ll use a materialised form of products for a certain moment in time. In a production environment, we would process CDC (Capture Data Changes) to get the full advantages of time travel.
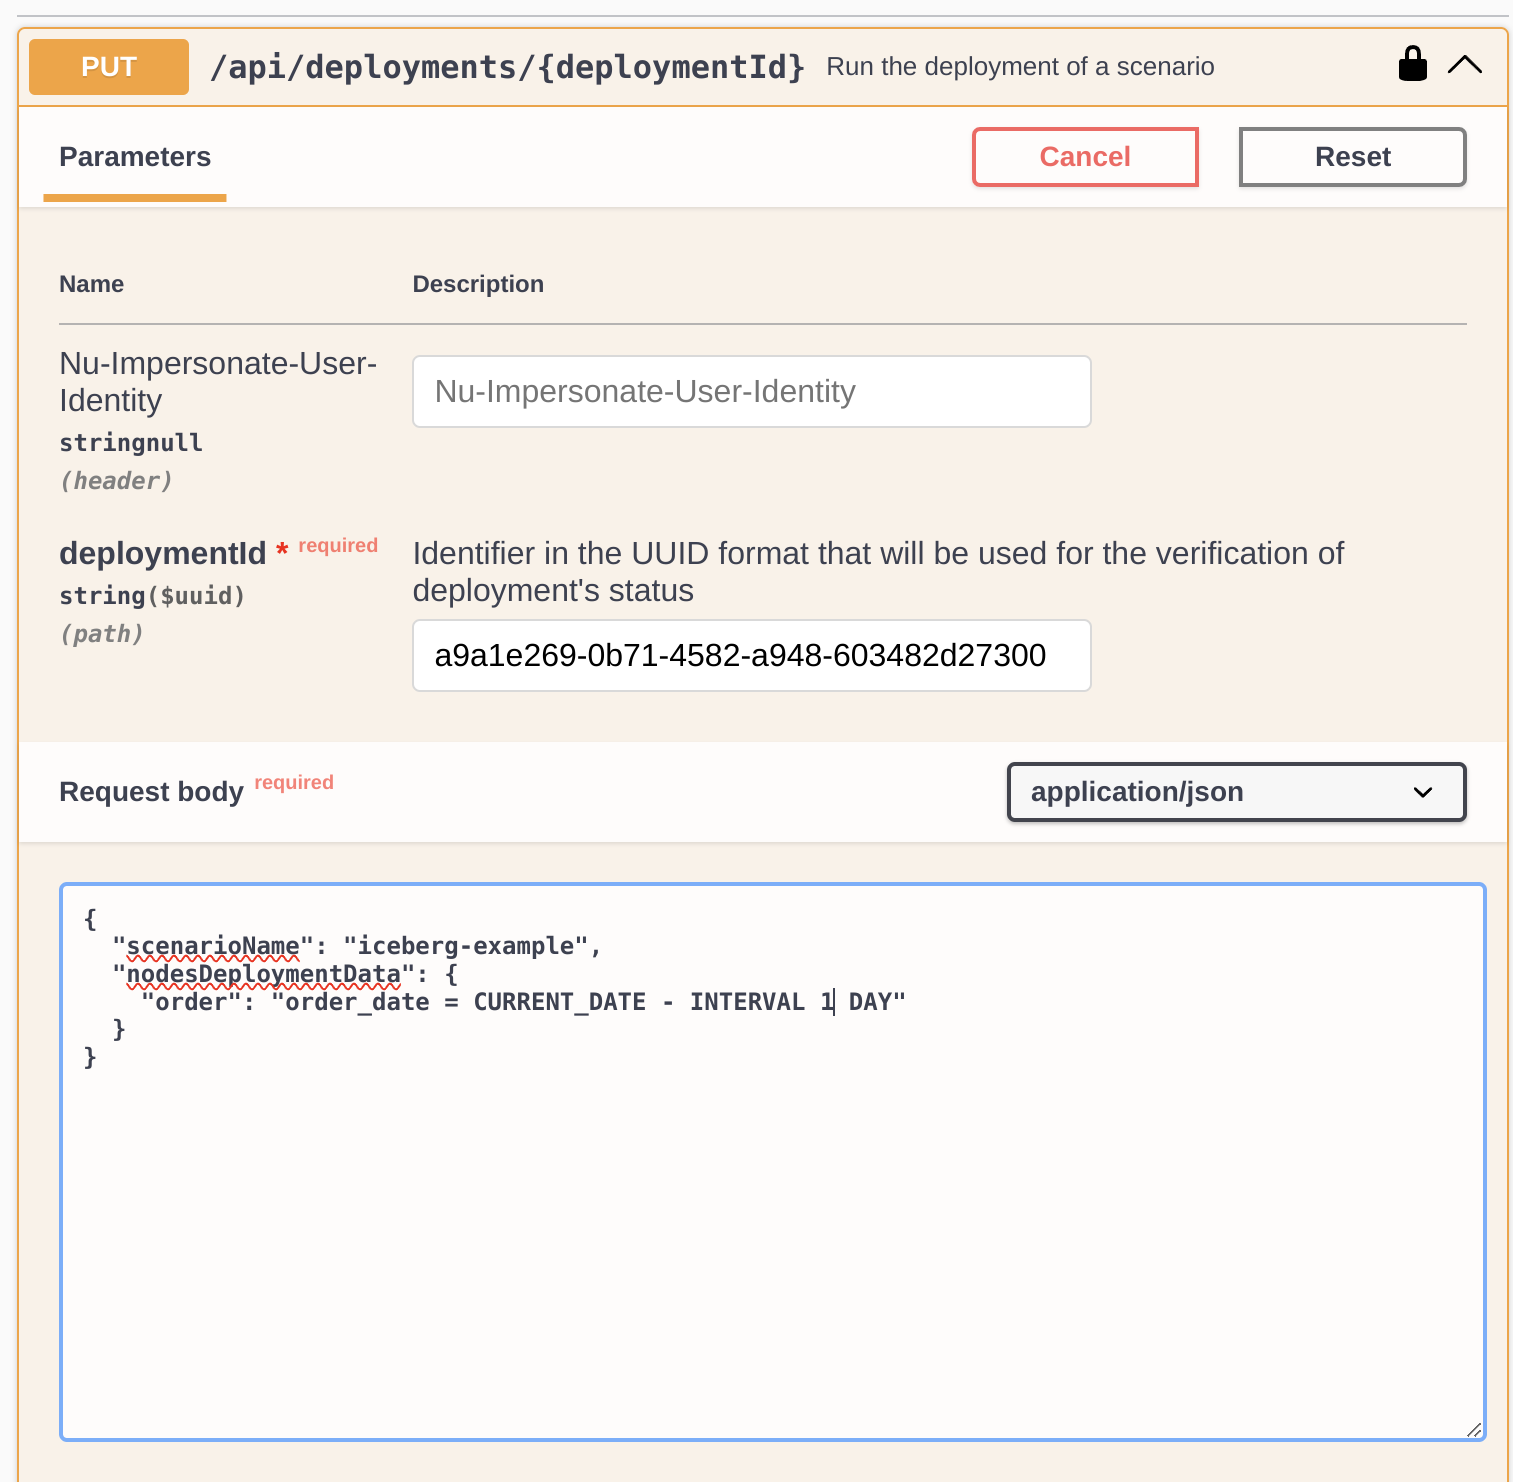
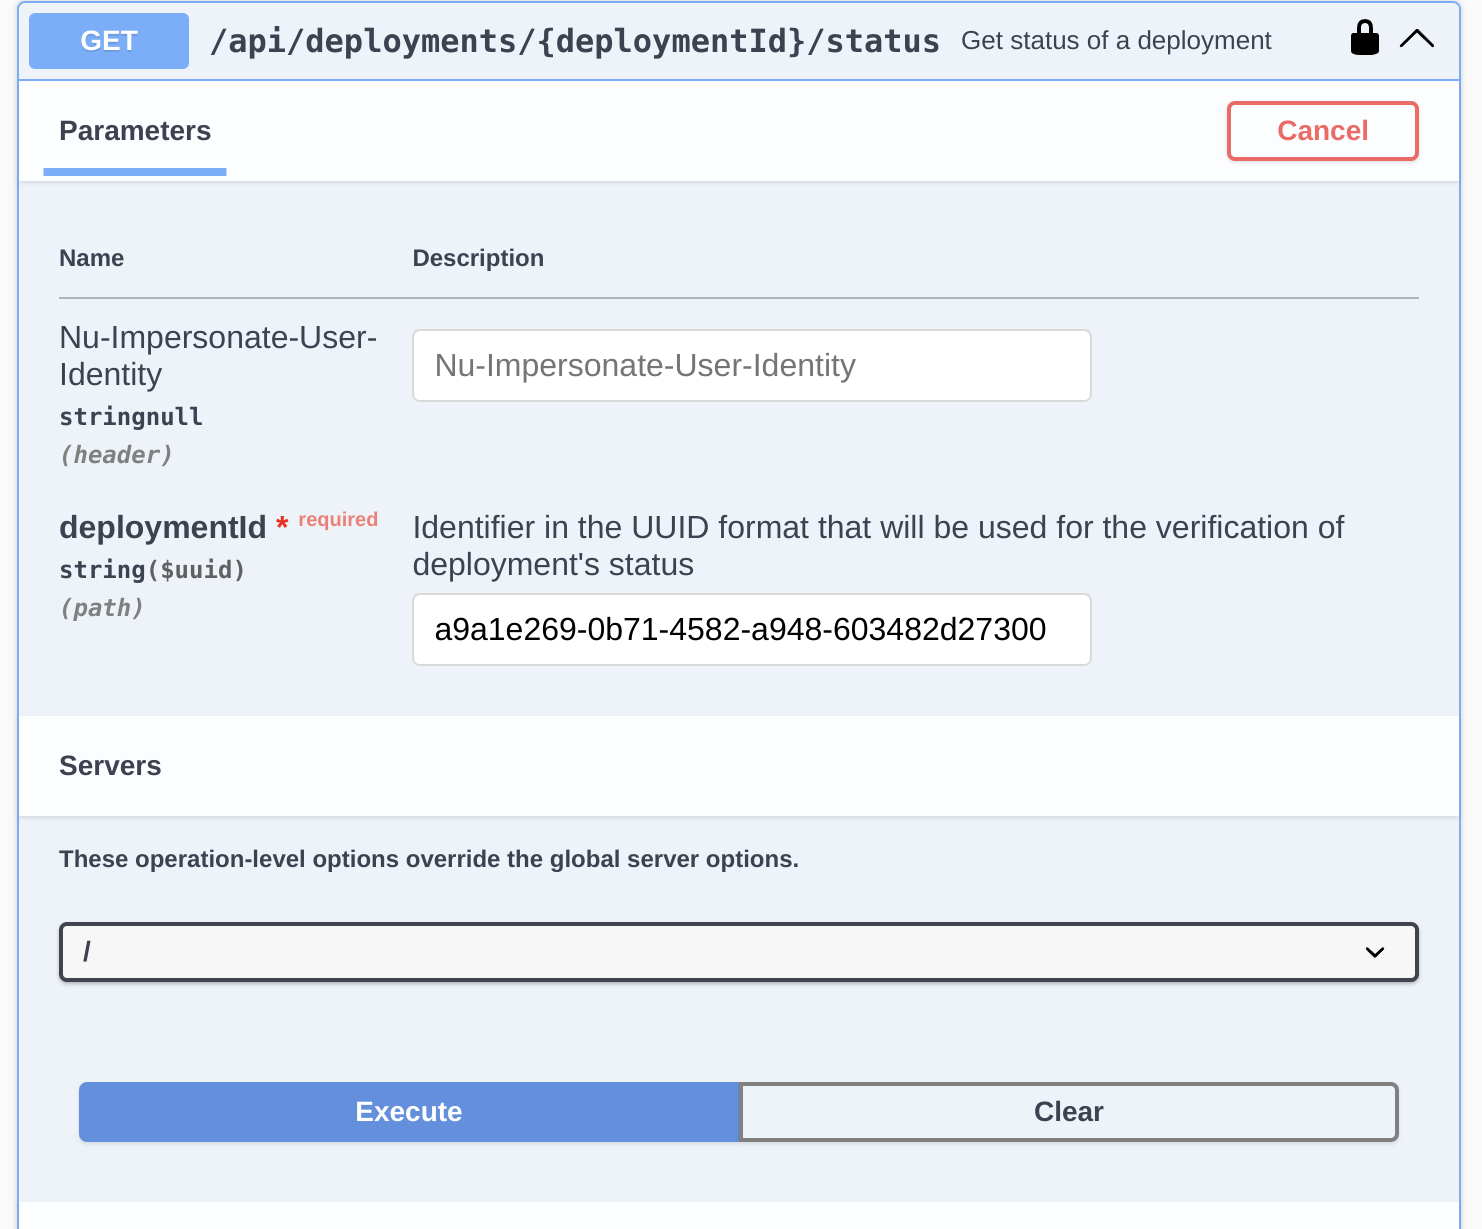
  3. We omit the scheduler step. Instead, we’ll show what the invocation of Nussknacker deployment’s API would look like. In a production environment, we might use an application such as Apache Airflow or crontab for that.
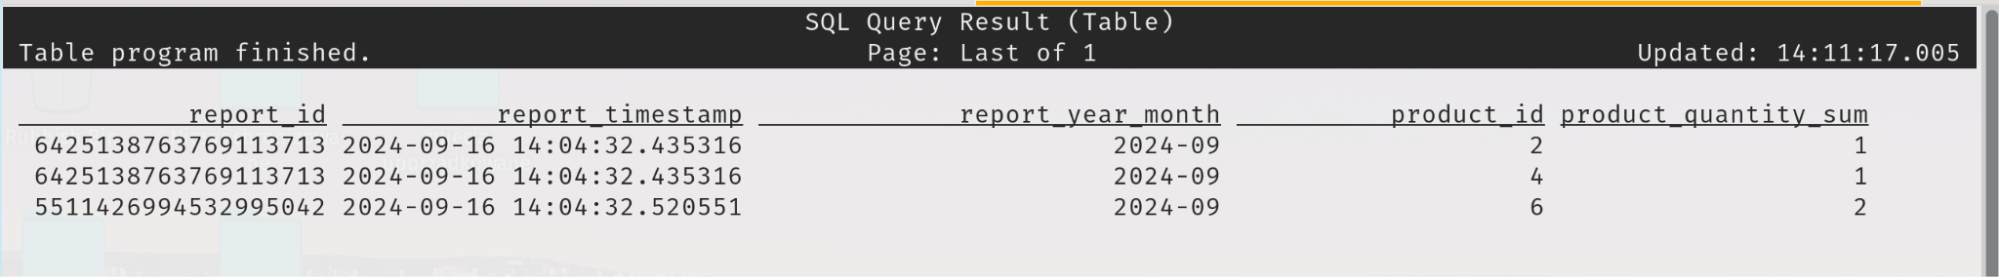
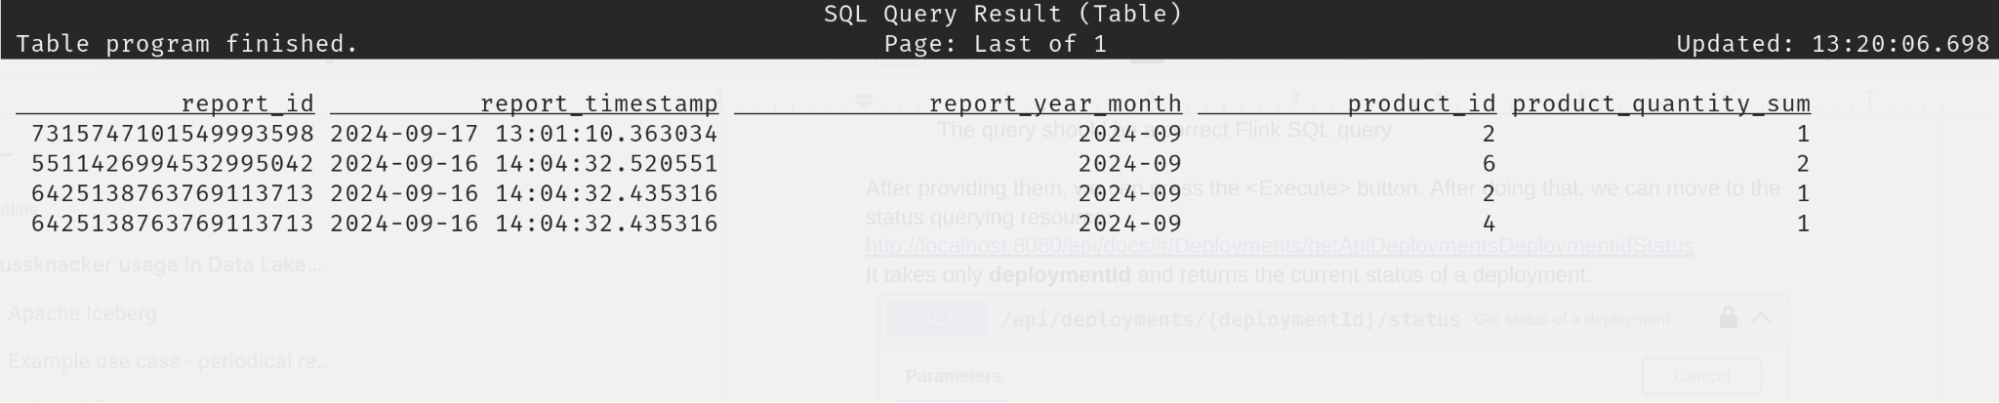
  4. We will also skip the egress step – as was the case with ingestion, it can be done by combining Nussknacker with a connector handling email delivery. We’ll only check the result by querying the result table with Flink SQL.

Setup preparation

Before we walk through the whole process, we must prepare the setup.

The example setup is available in the GitHub repository. You can just clone the repository and jump to the “Use case implementation” if you want to skip this part. But if you want to read how such a setup is prepared, follow the instructions below.

1. Bootstrap

I followed the instructions available in Nussknacker documentation, cloned the installation example repository and invoked ./start.sh script.

After this step, the designer is available at http://localhost:8080, user: admin, password: admin. I can create a scenario, but Batch processing mode with table components is not available yet.

2. Enabling batch processing mode

To enable batch processing, I changed the designer/application-customizations.conf file by adding the batch scenario type:

After executing ./start.sh again, batch processing mode appeared:

But when I drag & drop the table source, I see that only predefined tables are available. To change it, we need to connect the Designer with a catalog.

3. MinIO storage setup

But before we do this, we need to add a storage for data. I’ll use MinIO for that. I added MinIO containers:


volume:

and network:

We also have to add:

to every container. Explicit docker network configuration and warehouse.minio alias are necessary because we will use s3://warehouse urls which will be resolved to warehouse.minio host by S3 clients.

After this, we can invoke ./start.sh. MinIO console is available at http://localhost:9001/login, user: admin, password: password. Now let’s configure a catalog.

4. Nessie catalog setup

To run Nessie catalog, we need to create another db in our postgres. To do this, we need to add a setup container for postgres

In the create-db.sh script there is a simple logic that creates database if it doesn’t exist:

After that, we can run Nessie with JDBC connection configured:

After another ./start.sh invocation, Nessie web console is available at http://localhost:19120/. Now we can connect Nussknacker with the Nessie catalog. 

5. Nussknacker catalog configuration

We can replace previous, tableDefinitionFilePath:${TABLES_DEFINITION_FILE} with catalog configuration:

As you can see, we use specific connector classes: NessieCatalogand S3FileIO so we need to add dependencies that make these classes available for Nussknacker. To do this, we need to create a Dockerfile for the Designer inside the designer directory:

and replace image property with build property inside docker-compose.yml:

We also have to add S3-specific environment variables

After this, we can list available tables inside Nussknacker but the list is empty. To change it, we need to populate the Nessie catalog with definitions of tables. The easiest way to do this is to use the Flink SQL console. But before we do this, we need to add missing dependencies to Flink as well.

6. Flink setup

To do this, we need to change the Dockerfile inside Flink directory by adding these lines: 

And by adding the same arguments to build context as in the Designer case and the same environment variables.

We have also to add one entry in flink/flink.properties:

It is necessary because Iceberg has included another version of Dropwizard than Flink has. Also, iceberg-flink-runtime is available in both Flink’s and Nussknacker’s job classpaths and we want to avoid a collision between them.

After another ./start.sh invocation we can access the Flink SQL console via:

And define the catalog:

From this moment on, the current Flink SQL session will use Nessie as its default catalog. It is not persisted so you need to repeat it after each sql-client.sh execution. Let’s create a table to check whether everything works correctly.

After the query is finished, we can check that it is also available at Nessie Catalog. We can also navigate to MinIO Console and take a look at metada.json. The table is also visible in Nussknacker:

Now the setup preparation stage is finished, we can follow our use case.

Use case implementation

1. Data ingestion

As described in the “Simplifications” section, I’ll mock the ingestion process with simulated insert queries into defined tables. Let’s define tables first:


and populate the database with sample records:

 2. Definition of the report in Nussknacker scenario

Once we’ve taken these steps, we can move on to the fun stuff: the scenario authoring process. As a reminder: we want to create a report that shows how many items of each product in the premium category were ordered the previous day.

I've described below each step I took in Nussknacker. You can repeat them on your own or import the ready iceberg-example.json from the main directory in the nussknacker-iceberg-example GH repository and just scroll down to the 3. The report step.

Firstly, we need to join all necessary tables: orders, order_items and products. We need to split it into two joins because Nussknacker supports the joining of only two branches. I decided to pick orders as the MAIN branch, but in INNER joins it is not so important. Join for items:

And similar join for products:

After necessary enrichments, we can filter order items by a product’s category:

And compute the sum of quantities for each product:

After this, we have almost everything. One thing that is missing is the target table where we want to save the report. For now, I’ve ended the scenario with a dead-end node and postponed this step to the next section. The whole diagram can be seen in the picture below.

3. The report content

Let’s define the table where we save the report. To do this, we need to login to the Flink SQL console again:

docker compose exec flink-jobmanager sql-client.sh

Connect to the catalog:

And define the report table:

Now we can use it in the scenario:

The report_id, report_timestamp and report_year_month fields can’t be filled yet (Side note: if you imported the scenario JSON, it is already filled). Each expression in this sink is invoked for each product – because #product.id was used as a key for grouping.

In order to achieve a batch-global variable, we will use previousValue component with some constant (e.g. blank string) key:

Now we can use this global variable in the sink:

The final version of the scenario looks like this.

We can click the deploy button. After a short while, the deploy changed the state to finished. We can check the result of processing in Flink SQL by:


We have a report for all orders from the beginning of their collection. Clearly, this isn’t exactly what we wanted. What we wanted was a daily report for orders from the previous day. We also wanted to emulate a scheduled script requesting the report.

4. Scheduler integration

As I mentioned in the Simplifications section, I won’t write a scheduling part. Instead, I’ll show how to use Nussknacker’s REST API. To see what resources are exposed by the Designer, you can check http://localhost:8080/api/docs. In the http://localhost:8080/api/docs/#/Deployments section are the resources that we are interested in. Let’s pick the PUT one and press the <Try it out> button:

We need to provide data:

  • deploymentId – a unique UUID which will be used for querying the status of the deployment
  • scenarioName – the name of the scenario that we want to run
  • nodeDeploymentData – a map of a node on filtering query that will be used for table filtering. The query should be a correct Flink SQL query expression. Warning: if you run the example with sample data from the Data ingestion step, you’ll probably have to change the interval to some longer period.

After providing them, we can press the <Execute> button. Now we can move to the status querying resource: http://localhost:8080/api/docs/#/Deployments/getApiDeploymentsDeploymentidStatus 

It takes only deploymentId and returns the current status of a deployment.

At the beginning, the STATUS inside the response was DURING_DEPLOY, but after a short while, it changed to FINISHED.

When we run the query again, we see that there is a new report, with data only for the first day (from 2024-09-12):

Further works

Requests that I’ve made can be now replaced by, for example, cURL invocation (see the box below in Responses section inside Swagger UI) and registered in some scheduler such as crontab.

We also have to wrap the result of the report in a more human-readable format – for example, a spreadsheet file or some chart and send it to the target audience via Mail Delivery System. But we won't be going into that here.

Conclusion

Apache Iceberg is a solid component of a modern Data Lakehouse architecture. The experience of working with it is similar to standard RDBMS, but under the hood, a typical S3-compatible document storage service is used to store the data. What’s more, it’s based on open specifications, so you can combine a lot of tools on top of it. This makes it a good foundation for data analytics platforms.

Nussknacker integrates seamlessly with Apache Iceberg. Once you’ve prepared the setup, you can implement the tasks of your business use case, such as data ingestion, egression, transformations, feature extraction, business logic application and model inference in Nussknacker without extensive coding. You have a friendly user interface with a rich set of ready-made building blocks (which we call “components”), flexible expression language and all the benefits of Apache Flink which is used under the hood: a rich set of connectors, stateful processing, unified batch & stream processing. Finally, the implemented logic can be easily triggered by another application thanks to the REST API.

You can play with this pairing yourself – a good starting point is nussknacker-iceberg-example repository. This example only shows a basic use case; for more advanced use cases, for instance, ML models inference in fraud detection, visit our blog. If you would like to know more, please contact us at enterprise@nussknacker.io.